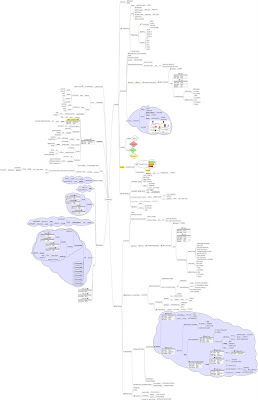
What is the Benefit of Colored Branches? Idea Map #92 and Hint #20
 On Wednesday, March 5, 2008 I introduced you to Jay Dugger -- long-time mind mapper. The purpose of this posting is two-fold. First, the full version jpg of Jay's map titled "Mapping" is now available above and in pdf format at my website under "Additional Maps". If you click on any column it will sort alphabetically by author or title of the map. Secondly, I promised to address the issue of line color. That will be today's Hint #20.
Keep in mind these are not rules that need to be followed, just helpful hint that can be applied depending on your purpose.
- The branches surrounding the central image are sometimes thicker to show that they are a main thought.
- Let's say you have one branch that is red along with all sub branches that attach to it in any way. The ideas are now connected in two ways -- both physically and visually.
- If each main branch (and associated sub branches) is a different it makes the branches stand out from each other.
Labels: benefit of colored branches, Flickr, Freemind, FreeMindShare, helpful hint, idea mapping example, Jay Dugger, mappio, mind mapping example, mind mapping techniques
 Stumble It!
 del.icio.us
 Squidoo
 Technorati


